Reasons to be cheerful
In our recent investment bulletin, we highlighted how extreme some of the recent market moves have been.
We’ve seen some big moves in both directions, but unfortunately there have been more sharp down days than up days of late. These have often been triggered by what would normally be seen as very minor issues.
For example, US inflation fell in April to 8.3% having been 8.5% in March. Markets had been expecting it to drop a bit more, perhaps to 8.1%. (Source: Financial Times)
This minor ‘miss’ of just 0.2% triggered global market falls, including a 3.2% drop in the Nasdaq index of US technology stocks.
We’ve also heard that the UK economy contracted by 0.1% in March, against expectations of a flat (0%) month. Again, this is a 0.1% miss but triggered a drop in the value of the pound. (Source: Financial Times)
We used to joke that bad news is often seen as good news by markets (and vice versa), since it means more likelihood of central bank stimulus. Right now, it feels like good news is seen as bad news and bad news seen as worse!
Markets are extremely pessimistic and investors are very jumpy. However, we believe they are being far too negative and therefore in this edition of The Pulse we wanted to highlight a few ‘reasons to be cheerful’ instead.
Part 1: Cause for optimism
“The only thing we have to fear is fear itself.” – Frankin D Roosevelt
Well perhaps not the only thing, but the extreme pessimism in the market is in itself a possible cause for optimism.
American investment analyst, Charlie Bilello, recently carried out some highly unusual number crunching.
Every so often, when markets are volatile, news service CNBC runs a ‘Markets in Turmoil’ special. They seem to have an uncanny knack of doing so just as markets near the bottom.
Since the first special was aired in 2010, the average one-year return of the S&P 500 Index after the broadcast was 40% and markets have also gone up 100% of the time. (Source: Compound Advisors)
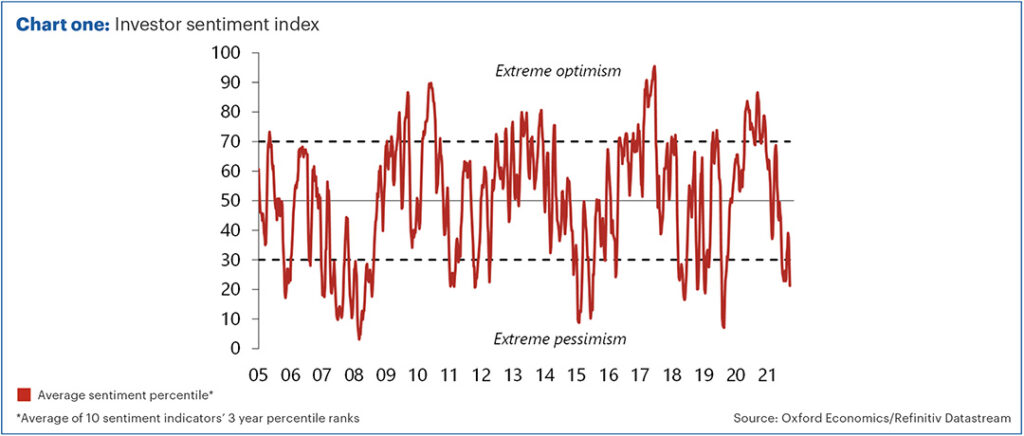
This is only a limited data set and a light-hearted way of looking at things, but there is a long history of research into investor sentiment. In short, when sentiment is at its lowest, that’s often a good time to buy. Likewise, when markets are exuberant, that’s often a negative sign.
Chart one shows sentiment reaching almost the lows of the pandemic, after which, the bounce was spectacular.

As we explained in our recent bulletin, markets are worried about three things:
- high inflation
- rising interest rates
- fears of recession
We believe it extremely unlikely that all three happen at the same time.
Should the economy enter recession, then we think rates are more likely to be cut than hiked.
An economic downturn would also likely reduce inflation. In the past few days, when investors have started to worry about growth, energy prices have come down in anticipation of lower demand. This reduces some of the inflationary pressures.
Meanwhile, if inflation was lower, that reduces some of the downward pressure on the economy and lessens the chance of rates going up.
With markets reacting so strongly to minor pieces of bad news, should there be even slightly better news, they could potentially react just as strongly in the other direction and we could see a strong bounce.
Part 2: Underlying economic and company data is still strong
Here in the UK, unemployment is at historically low levels of 3.8%.
In the US, unemployment is 3.6%. Employment in both countries has recovered to pre-pandemic levels and companies are reporting difficulties in recruiting suitable candidates. Wages are going up strongly in nominal terms as a result, albeit prices at present are going up even more. (Source for employment data: Trading Economics)
There are also reasons to think that many people have built up some savings over the past few years due to lower spending.
During the pandemic, the savings rate shot up to 23.9% of income by mid-2020, having been just 4.5% at the end of 2019. Even at the end of 2021, this was still 6.8% on average. (Source: Office of National Statistics)
With wages going up and savings levels high, in aggregate, people have rarely been better placed to weather the short-term inflationary pressures.
That’s not to diminish some of the hardship that those on lower incomes may face at present.
Companies also continue to report decent underlying numbers. According to research firm FundStrat (as of 9 May), based on the recent US earnings season:
- 88% of those reporting are beating estimates.
- Estimated earnings growth is 11.9% over the past 12 months.
Of course, that’s backward-looking data, but forward-looking estimates remain positive.
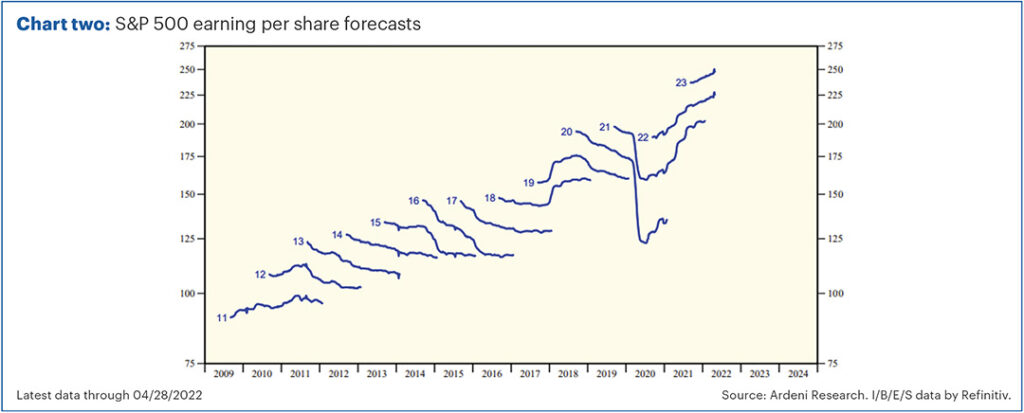
Chart two shows analyst estimates for earnings per share in the US stock market. We affectionally call this the ‘worm chart’.
The individual ‘worms’ for each year show analysts’ estimates for earnings per share for each calendar year. The worms track how those estimates changed over time, from usually a couple of years prior, to when we finally have the actual data.
Most of the worms point downwards. Analysts are usually too optimistic and have to cut their estimates over time.

The worms for 2022 and 2023 are pointing upwards. Earnings estimates in aggregate are being revised up, not downwards.
Companies are currently doing fine despite all the doom and gloom in the headlines.
Part 3: Price ≠ value
Price does not equal value.
If company earnings are going up and the price is going down, then the price/earnings (PE) ratio is getting lower. Markets are getting cheaper.
The UK stock market now trades on a P/E of 15.6 times based on reported earnings and 10.9 times predicted earnings for next year. Historically, we’ve seen some pretty good returns when we’ve experienced such levels in the past. (Source: Equilibrium Investment Management / Refinitiv Datastream)
If you are prepared to be selective, there is potentially even better value.
One of the UK funds we hold in portfolios, which specialises in smaller companies, is now trading on a P/E of just 7.5 times earnings. The fund pays a dividend yield of just shy of 5% and underlying earnings are growing at around 10% p.a. (Source: Morningstar)
If that can be sustained, we see this as an absolute bargain and have topped up in most of our portfolios.
Value is appearing in other markets. Here in the UK, industrial property has returned almost 10% so far this year from a combination of rent and capital growth, according to CBRE. However, that’s if you own the underlying buildings.
We own industrial property via a couple of real estate investment trusts in portfolios – Segro and Tritax Big Box. Their share prices were hit recently when Amazon warned they had more capacity than they needed in their distribution warehouses.
Segro is now down 23% so far this year. (Source: FE Analytics, to 10 May 2022)
However, according to a recent article in the Financial Times (FT), vacancies in distribution warehouses are currently at a record low. Even if Amazon were to vacate 10% of its stock (which is extremely unlikely), that would move the vacancy rate to 3.6% – well below the 5.8% average since 2015. (Source: FT.com)
When an underlying asset class moves up by 10%, whilst the share price of a company who own those assets drops 23%, this is a big disconnect and we think this represents good value.
Part 4: Inflation might just have peaked
As mentioned earlier, the US inflation rate was 8.3% in April. This is a very high number, but it is down from 8.5% the previous month.
Remember that inflation is always quoted as a year-on-year percentage. The headline figure fell despite prices increasing more in April than they had in March.
This is simply because of ‘base effects’ – the headline figure is so high partly because prices were low a year ago. Those lower prices now start to drop out of the annual figures, with future inflation figures starting from a ‘higher base’.
The peak in US inflation is partly because oil and gas prices have come down from their recent peak.
In the UK, because of the price cap on our energy bills, some of the price rises have been deferred until later this year. This helps spread out some costs but means UK inflation will peak later and perhaps could reach as high as 10% later this year, before dropping back.
Part 5: Interest rates may not rise as much as expected
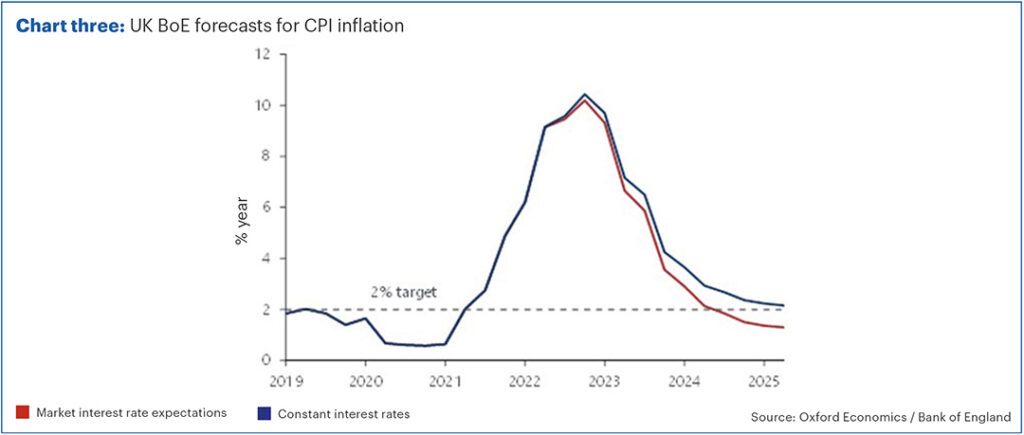
The Bank of England recently increased interest rates to 1%. However, the accompanying inflation forecast contained some signs that they may not put up rates much further.
Chart three shows the Bank’s prediction for inflation based on different rate assumptions. The blue line assumes rates remain steady at 1%. The red line is based on market assumptions for interest rates to go up to 2% or more.

Whilst inflation is predicted to peak later this year in both scenarios, it is also expected to come down rapidly in both cases.
Based on market assumptions, inflation drops back to the 2% target in 2024 and then moves significantly below. However, if rates remain at 1%, we get back to target in 2025 and remain around that level.
The 2% is a target rate, not an upper bound. If inflation is 1% below target, the Governor of the Bank of England has to write to the Chancellor to explain, just as he does if it is 1% above target.
In our view, this means the Bank thinks that interest rates might not need to go up as much as the market expects. If so, we think some bonds could rally.
Part 6: Real assets have provided real returns
Equities and bonds have both fallen significantly so far this year. However, we’ve always tried to be more diversified than just holding those two asset classes.
In particular, we’ve recently allocated more to ‘real assets’ like property, infrastructure and, more recently, forestry.
The forestry fund we hold has gone up 13.5% so far this year. Unfortunately, we are limited to how much we can invest in this asset class, since there are few available funds at present with limited liquidity.
However, infrastructure has also done well with our infrastructure portfolio up by 5.03%. Property has been more mixed, but some funds have seen strong performance, with supermarkets up by 3.61%. (Source for fund return data: FE Analytics to 10 May 2022)
We now hold around 15% of portfolios in real assets such as these. We have also seen positive returns from some of our alternative equity funds, but the real stand-out fund has been surprising.
Our dollar cash fund, held in our defensive and cautious portfolios, is up by 10% so far this year. This has very little to do with the interest paid and is mainly from exchange rate movements, with the pound falling so much against the dollar.
We would not have expected this to be one of our best performing holdings, but that said, the reason for holding it in our more cautious funds is because the dollar tends to rally when fear is present in markets.
In all our funds, we like to rebalance regularly, taking profits from the funds which have done well and recycling the capital into other assets which now look better value in our view.
We’ve tried to provide some positivity in this edition of ‘The Pulse’ given the amount of negative sentiment out there. It is never nice when portfolios fall in value and we certainly don’t seek to downplay this. Unfortunately, it is inevitable that it will happen from time to time, which is why we always stress that investing is for the long term.
However, we also think there are reasons to be optimistic about future returns.
Past performance is for illustrative purposes only and cannot be guaranteed to apply in the future.
This blog is intended as an information piece and does not constitute a solicitation of investment advice.


