

Executive Summary
- Changes in power generation and new sources of energy have increased the UK’s dependency on gas in the last decade.
- But over the last year, gas prices have become detached from the fundamentals of demand and supply, due mainly to financial speculation.
- The mechanics of the global energy system will serve to fill the gap left by Russia, but it will take time.
- In the meantime, the UK government will be reducing the short-term impact on households and businesses by introducing limits on energy bills.
Any student of physics will tell you that in the history of the universe, no energy has ever been created or destroyed. So, when the headlines scream “energy shortage crisis!”, what they really mean is that on a global scale, the energy is just in the wrong place.
That is not making light of the situation; however, dramatic shortages have had a massive impact on the market prices for energy, especially gas, which may have a serious impact on consumers and businesses.
If we take a step back, why has the gas price risen so much?
Up until the late-2000’s, if you owned a power station, you generally had a choice as to whether to burn oil or gas in the furnace, you could substitute one for the other depending on the price. This led to a linkage between the oil price which was generally an oil –to –gas ratio of around 6:1 which is derived from the fact that one barrel of oil is equivalent to 5.85 million British thermal units (mmBtu).
This continued until the Credit Crisis, when the price of oil rose significantly, and the ratio pushed up to 56:1 in 2012, when oil prices hit nearly $150/barrel. The subsequent raised oil price and the introduction of new sources of gas from fracking and Russia, resulted in the ratio moving back to nearer 15:1 thereafter, as shown in chart one below: –
Chart one
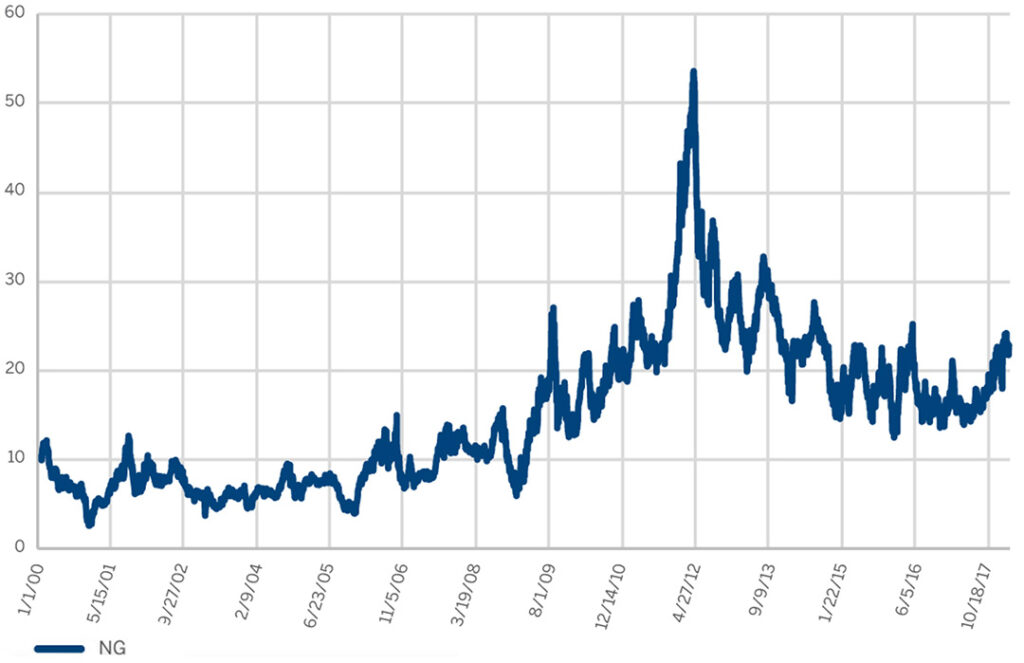
Source: cmegroup.com/are crude oil and natural gas prices
These new sources of cheaper and relatively cleaner gas, plus the retirement and closure of coal, old nuclear and some oil-fired power stations, meant that gas-powered electricity in the UK rose from 24% of total electricity production in 1990 to 42% in 2020. This increase in the new generation pushed up the dependency on gas as a source of energy and left the country vulnerable to a gas price shock.
This brings us up to date. The conflict in Ukraine, the sanctions and the resultant reduction in exports of gas by Russia, have pushed gas prices to an incredible $100mmBtu by the end of August this year, which compares to the oil price at around $100/barrel. In other words, a ratio of 1:1. To put this in context, to get to our original 15:1 ratio, the gas price should be $7mmBtu, not $100.
What has happened to all those gas users who should switch to oil?
Apart from the fact that many of the newer gas-powered power generators lack the pipelines and port facilities to switch to oil, the broader move to cleaner energy sources has meant that resources have been directed more to renewables. Gas was seen as a stepping stone to a future fuelled by greener energy sources.
Food for thought
That is not the end of the story.
The gas price has become disconnected from fundamentals for another important reason, speculation.
A recent study found that trading volumes at the European Union natural gas market’s primary gas-pricing hub, increased steadily over the past decade, from 14 times actual gas consumption in 2011 to more than 114 times in 2020. (Source: The Oxford Institute for Energy Studies, July 2021)
That was two years ago and since then, the number of funds that invest or speculate on energy – and other commodities – has sky-rocketed. Hedge funds, commodity funds, oil and commodity trading houses and individual speculators, have all waded into the gas market, betting that Europe would be squeezed.
The gas market is not alone.
Data from Europe’s leading commodity exchange, Euronext, shows that between January 2020 and March 2022, investment funds increased their net buying positions by almost four times in the US wheat market. The price of soft red winter wheat soared from $332 per metric ton in January of this year to $672 per ton in April, reflecting this heightened speculation.
The chaos that such speculation can cause was evident in March this year, when a dramatic spike in nickel prices, forced the London Metal Exchange to suspend trading and cancel all deals. (Source: Financial Times, 12 March 2022)
Something similar happened in 2007-09 when oil and food prices first rose sharply and then declined to earlier levels in the space of 18 months.
After that experience and in the aftermath of the 2008 global financial crisis, both the United States and the EU sought to regulate commodity derivatives to some extent. The objectives were to: –
a) prevent speculation by ensuring that all trading occurs on regulated exchanges and in a transparent manner with full information about the actual traders.
b) only allow exchanges between those with a direct operational interest in commodities to trade them (for example, an airline company should be permitted to operate in the futures market for aviation fuel, but a hedge fund should not).
c) require buyers to adhere to limits on the positions that they can hold, depending on their real use, need, or production of that commodity.
However, in the event, regulatory changes did not go far enough, and have since been watered down.
This seems an unstoppable force. In the first eight months of 2022, Refinitiv reported a net inflow of over $24 (£19) billion into commodity funds.
Un-natural gas
The thing with speculative money is that it is flighty. These situations tend to become overbought, blow up into a bubble and eventually burst.
In the context of the European gas market, if you are a hedge fund and you know that the Nord Stream gas pipeline is absolutely shut, what do you do?
The supply of gas cannot get any lower. You sell. Since the Nord Stream was completely switched off in early September, the European gas price has fallen 30% – this is a price driven by speculation, not fundamental demand and supply of physical gas.
This is not the only route to lower gas prices. Traders love to arbitrage which just means being able to buy low and sell higher.
Liquified natural gas (LNG), where the gas is cooled to liquefy and make it easier to transport, is expensive and complicated but does allow for shipping of gas across the globe. LNG in Asia currently costs $58mmBtu and in the US, it is around $8mmBtu. Clearly, there is scope for buying in the US and selling in Europe. This is indeed what is happening with large fleets of LNG carriers heading out of the US towards Europe.
The UK gets around half of its annual gas supply from its own North Sea reserves, but relies on global markets, particularly Norway, for nearly a third and LNG for a fifth as can be seen in chart two below: –
Chart two
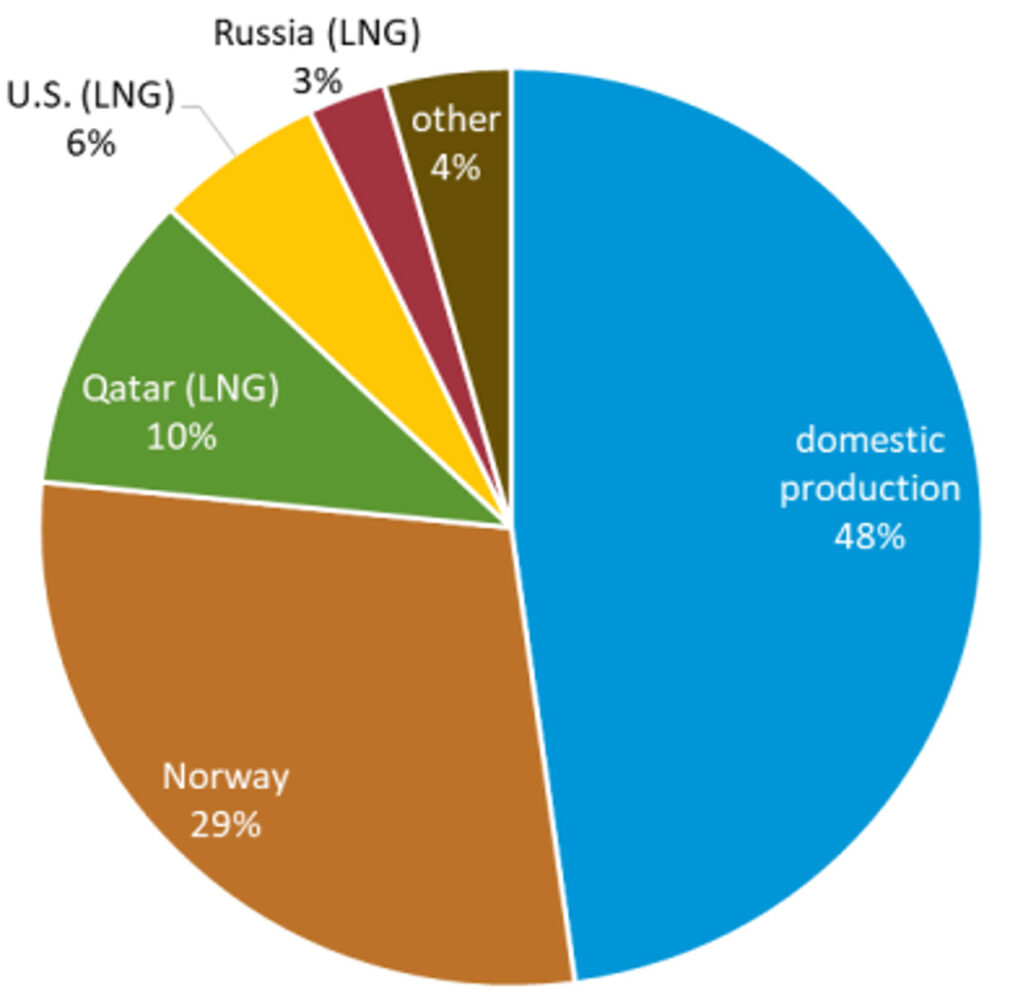
Source: U.S. Energy Information Administration, based on data from Digest of UK Energy
It has significantly ramped up LNG imports, but the UK stopped importing LNG at its terminals in May because the system had reached short-term capacity, the main problem being the lack of significant storage.
There are plans to reinstate Britain’s old Rough storage facility, which had been retired in 2017, but this will take time. Meanwhile, the UK must rely on shorter-term flexible contracts and the spot market, exposing consumers to greater price volatility.
In Europe, there are 29 LNG terminals with another 22 planned for construction but these normally take 3-5 years to complete and so will not help in the short term.
Increased supplies from Norway (who have already raised supply into Europe by 10% this year) and building of stocks over the summer ahead of winter – currently around 85% – will be the best short-term buffer for Europe. (Financial Times, 7 September 2022)
Therefore, the action of markets will serve to plug the gap but there are pricing pressures, exacerbated by speculators, that will make prices volatile in the short term. Over time, we would expect the supply vacuum from Russia to be filled by the remaining global energy sources.
Caps on
In the short term, to combat the direct hit to households and businesses, the UK government has announced two packages to reduce the burden. In April, it was announced that households would receive £400 off their energy bills (paid as £66pm over winter) and on 8th September it was announced that energy prices are to be capped.
A typical household will pay no more than £2,500 each year for the next two years which, including the £400, implies an average bill of around £2,100 for this winter. This compares to the £1,500 average energy bill that households have been paying in recent years but much less than would otherwise have been paid under Ofgem’s old formula, where there isn’t a total cap on how much you pay, but a cap on the standing charge and unit rate (the more you use, the more you pay).
Businesses will see their energy costs capped at the same price per unit that households will pay under the government’s new plans. The scheme will run for six months and will be reviewed in three months’ time to see if the help should be more targeted towards certain industries.
Past performance is for illustrative purposes only and cannot be guaranteed to apply in the future.
This blog is intended as an information piece and does not constitute a solicitation of investment advice.