Viruses and volatility

“When the facts change, I change my mind. What do you do sir?”
This quote is attributed to John Meynard Keynes, the great economist (and investor). Whether or not he actually said it is another matter, but to us this is a key part of our investment philosophy.
We have a set way that we deal with big moves in markets. We think it is vital to have a plan in advance so we always know what our response might be.
Our ‘volatility plan’ always has three initial stages:
- First volatility trade: when the market drops to a pre-determined market level, we top up equities by between 2% and 5% (depending on portfolio). In the recent market moves our first ‘trigger level’ was at 7,150 and we bought a FTSE tracking fund as set out in the plan.
- Second volatility trade at a lower level: in this case, our trigger was at 6,750 and this time we bought between 2% and 3% of portfolios.
- Pause and reassess. When the market drops below our second buy point we stop and work out what has changed, and if our strategy remains appropriate.
We get to stage one on a fairly regular basis and occasionally get to stage two. Often, big drops in markets are short lived and we can sell our volatility trades again when they recover, usually targeting a 5% gain.
We rarely get to stage three, the last time being around the Brexit referendum.
What has happened so far?
Stock markets have dropped sharply.
After the FTSE 100 closed above 7,400 on Friday 21 February, the market fell rapidly over the next week. At one point on Friday 28 February the FTSE 100 was as low as 6,460 – almost 1,000 points down in a single week. The FTSE ended the month at 6,580, around 11% lower than a week earlier.
Other stock markets fell just as sharply, with the S&P 500 seeing its fastest correction in history. A correction is defined as a fall of 10% or more. Interestingly, Chinese markets held up quite well in this period having had a big scare in mid-January.
Over the same period our balanced portfolio fell by 4.7%.
Have the facts changed?
So, have the facts changed? The short answer is “yes they have”, and this has slightly altered our strategy.
Over the past week or so it has become clear that the virus has spread much more widely than it had previously appeared.
This is likely to have an effect on economies, on company earnings, and therefore onto the value of shares.
Below is a summary of what we know about the virus and what we think the impact is. Clearly, we are not medical experts and whilst our information is taken from reputable sources, as yet much remains unclear.
How deadly is it?
Based on what we know, the virus has killed between 1% to 2% of the people who have caught it. About 20% have ended up with a serious respiratory illness.
This would make it perhaps 10 times more dangerous than seasonal flu, which kills around 0.1% of people who get it. However, it is way less deadly than something like SARS, which had a 10% mortality rate.
Most of the people who died had underlying health conditions. Unlike many viruses which tend to be most serious for the very old and very young, there have been no fatalities of people younger than 10 years old. Based on available data for Covid-19, its deadliness seems to directly correlate with age, as shown in table one below:
Table one:
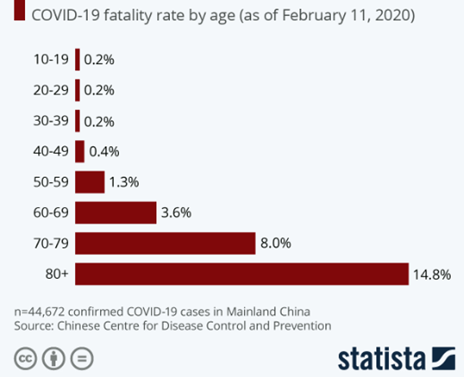
Source: Statista / CCDCP
How contagious is it?
Based on the various studies so far, people who get the coronavirus tend to infect around 2.2 other people on average (but estimates range from 1.4 to 3.8). This infection rate is known as the R0 (pronounced “R-nought”).
This is higher than seasonal flu which has an R0 of around 1.3. However, it is way less than something like measles which has an R0 of between 12 and 18.
This is just an average infection rate and is, of course, affected by behaviour. Containment or quarantine measures can bring it down. SARS only had an infection rate of 0.4 after containment measures.
Unlike many viruses, the coronavirus appears to be contagious even before symptoms appear (although probably much less so than when the patient is coughing and sneezing). This complicates matters and means it could have already spread further than we previously thought without people even knowing.
What will be the economic impact?
It is likely to be significant, but hopefully temporary.
We know that China was essentially shut down for an additional two weeks after its New Year holiday. Even since they’ve officially gone back to work, many factories and offices have remained closed whilst people have worked from home where they can.
The impact is difficult to track, but we can get some sense of the effect by looking at things like the amount of traffic on the roads, or coal consumed by power plants.
Charts one and two show these measures compared to the New Year period in previous years. Both coal consumption and traffic remain well below their usual levels, but they are seeing signs of picking up:
Chart one:
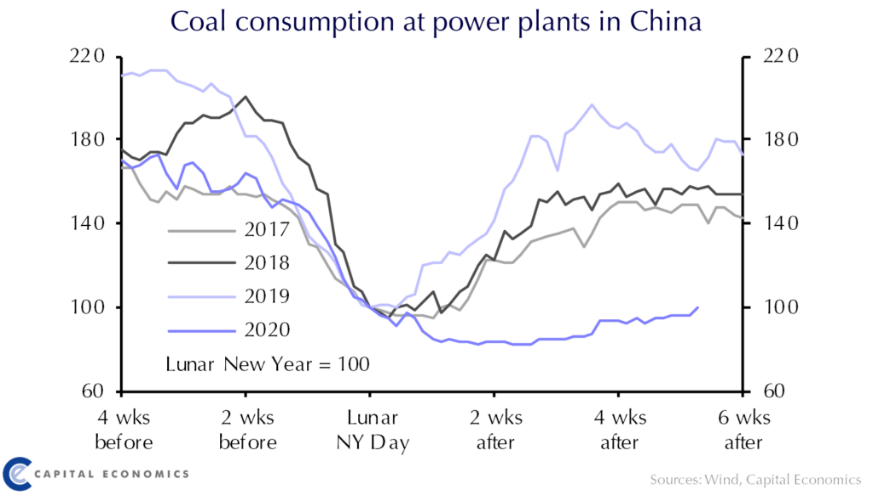
Chart two:
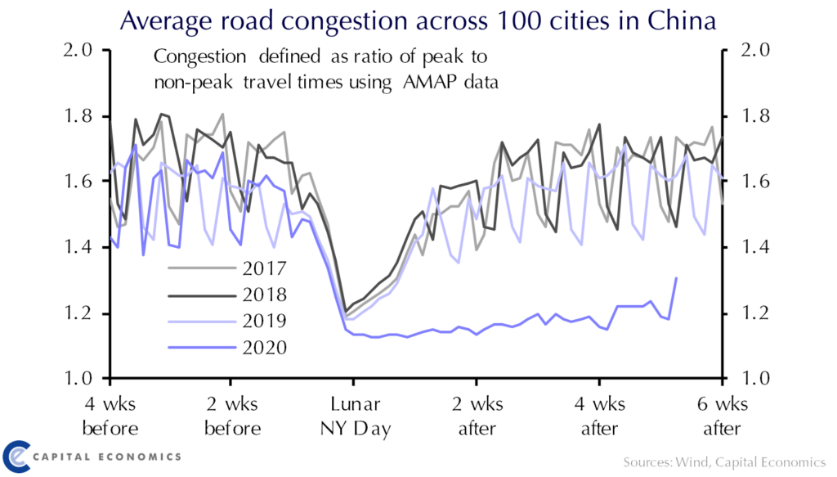
Source: Capital Economics as of 3 March 2020
China is the world’s second biggest economy but accounts for around a third of the world’s growth. Whilst it is difficult to calculate, we may well see zero growth in China in the first quarter of this year. However, there are reasons to think it could rebound later on as it returns to work.
In the rest of the world, we are further behind the curve. The virus has only just taken hold and looks likely to spread further. At the time of writing there are only 40 reported cases in the UK, but over 1,800 in Italy (and more than 50 people have died).
Italy will almost certainly see a recession. South Korea and Japan have been similarly hard hit. Japan will be worrying that the Olympics in June may not be able to go ahead (possibly moved to another country, or even postponed).
Countries which rely on tourism are likely to suffer too, which includes France and Spain. People are delaying or cancelling travel plans, even to relatively unaffected areas, with airlines and travel companies hard hit.
In the UK, we had been expecting growth to accelerate as businesses and consumers begin spending again after some clarity around Brexit. We also think we could see government spending pick up. These factors are significant, and it remains to be seen how and if a negative hit from the virus will impact this.
There are still many unknowns and the outlook will depend on how far the virus spreads globally. The other unknown is how temporary the economic effects will be.
Clearly, if people are stuck at home as we try to contain the spread, then they won’t spend as much as they normally do. Some of this spending will just be deferred. If you were planning to buy a car but didn’t because you were in quarantine, you may well still buy it but just later than planned. However, some of this spending loss could be “permanent” and won’t be made up later.
What this means is that the current quarter of economic growth is likely to be very weak, but later in the year we could see a relatively strong rebound if virus concerns abate.
How will central banks react?
We think central banks are likely to cut interest rates and provide liquidity into the financial system. We expect perhaps even a 0.5% rate cut from both the Bank of England and Federal Reserve, and maybe some additional quantitative easing too. (Addendum, since writing this the Fed have just cut rates by 0.5%).
Monetary conditions (the circulation of money around the economic system) have tightened a lot in the last week or two and banks will want to counteract this.
Normally, an interest rate cut is meant to address a “demand shock” – where people and companies are worried about the future and are reluctant to spend. A rate cut makes saving less attractive and borrowing more attractive.
There’s an argument that this may not make much difference if what we’re experiencing is more of a ‘supply shock’, for example where companies cannot make the goods to sell because the factory is shut. Arguably we’re seeing a bit of both!
Rate cuts also make it easier for companies to survive a temporary hit to earnings. There is always a danger that even a temporary loss of revenue can put a company out of business if they can’t pay their debts in the short term.
We believe the authorities will make sure banks have plenty of liquidity and will encourage them not to call in debts in the short term.
The potential for rate cuts has helped the fixed interest element of the portfolio to do well recently, generally making money at a time when equities have been falling.
What is the impact on company earnings, and therefore the value of their shares?
If there is a hit to the economy, then there will be a hit to company earnings.
Our job is to try and work out how this will impact on the value of their shares.
The first step that we’ve taken is to look at every market and every fund that we hold and try to determine how badly hit we think earnings will be. This is very much a ‘finger in the air’ exercise and the numbers are based on very little science at this stage.
Having adjusted what we think the earnings number is, we can then look at what impact this has on the price/earnings (PE) ratio of the market. This is one of our preferred measures of valuation. The lower the ratio, the ‘cheaper’ the market.
If we reduce the “E” of the PE then of course markets are more expensive than if we look at a PE ratio based on most recent reported earnings.
Table two shows how we think this might affect valuations. This is our current best guess based on what we know at present and will therefore change as we get new information. Our numbers are twelve month estimates and are generally based on the assumption that earnings will fall sharply in the next few months but then rebound.
Table two:
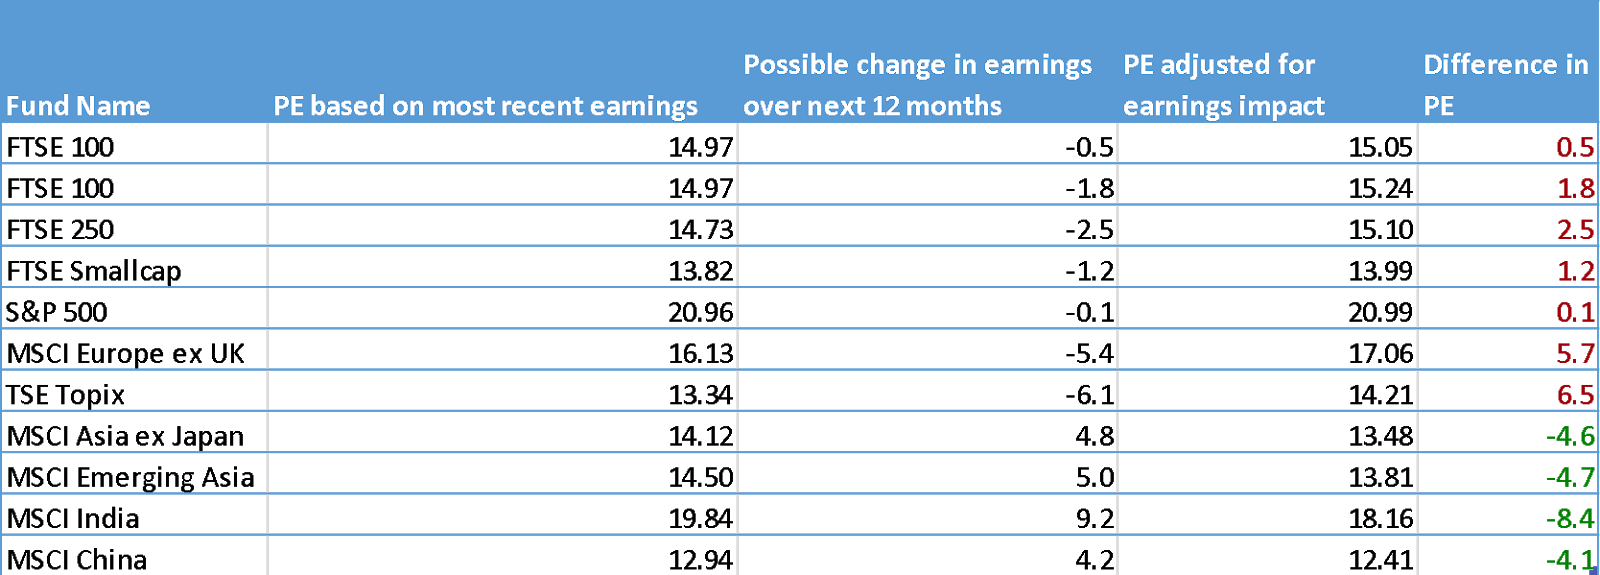
Source: Refinitiv Eikon / Equilibrium Investment Management
The upshot of this is that we think Europe is perhaps 5% more expensive than reported earnings would imply. Japan may be over 6% more expensive.
In emerging markets, we are still expecting company earnings to grow over the next twelve months, but less strongly than we had previously expected.
Clearly these numbers will need regularly revising, but by carrying out this exercise we can assess whether our current positioning should be changed.
Have we changed our strategy?
Yes and no. We’ve not changed our long-term strategy as yet but have made adjustments to short-term strategy.
Based on our current analysis, our preference for UK smaller companies and for emerging markets remains appropriate in the long term.
We were underweight in both the US and Europe already, which we think look expensive. There is a question mark as to whether we should reduce European exposure even further.
The one area we most need to reconsider is Japan. We had previously been overweight as we felt Japan looked relatively cheap compared to other regions, but the virus will likely make it less so. We will not make any snap judgements on this but will carry out further analysis before making any adjustments.
That is the long-term strategy. We have also adjusted our short-term strategy based on recent market movements.
Having bought when the FTSE 100 Index was at 6,750 in most portfolios last week, markets subsequently dropped even further. They fell as far as 6,450 before recovering. To use a technical term, this has broken a key resistance level and we think it very possible that things will get worse before they get better.
This morning, markets recovered back to around 6,800. We decided to sell this volatility trade in cautious portfolios, and half of the position in balanced, for a very small gain.
This reduces risk in the short term and gives us more firepower to buy back in at a lower level. We now aim to buy back in again at around the 6,550 level. We have not sold this position in adventurous portfolios but may still top up at 6,550.
As the facts continue to change, we will continue to evolve our strategy. However, it is important not to panic and to take a calm view of where we think things might be in one, two or even five years’ time.
Taking a longer-term view, we think buying now remains the right approach, but we also need to assess the short-term impact on volatility.
Have returns been in line with expectations?
Our philosophy is always to try and limit the downside when markets fall and capture as much as possible of the upside when markets go up. Clearly that is easier said than done!
Our newsletter from January looks at our how portfolios performed in 2018 when just about everything fell, compared to 2019 when most asset classes went up. If you’ve not read this, then we encourage you to do so by clicking here.
The tables below are from the January newsletter and show the returns of portfolios in both years relative to the average mixed investment fund.
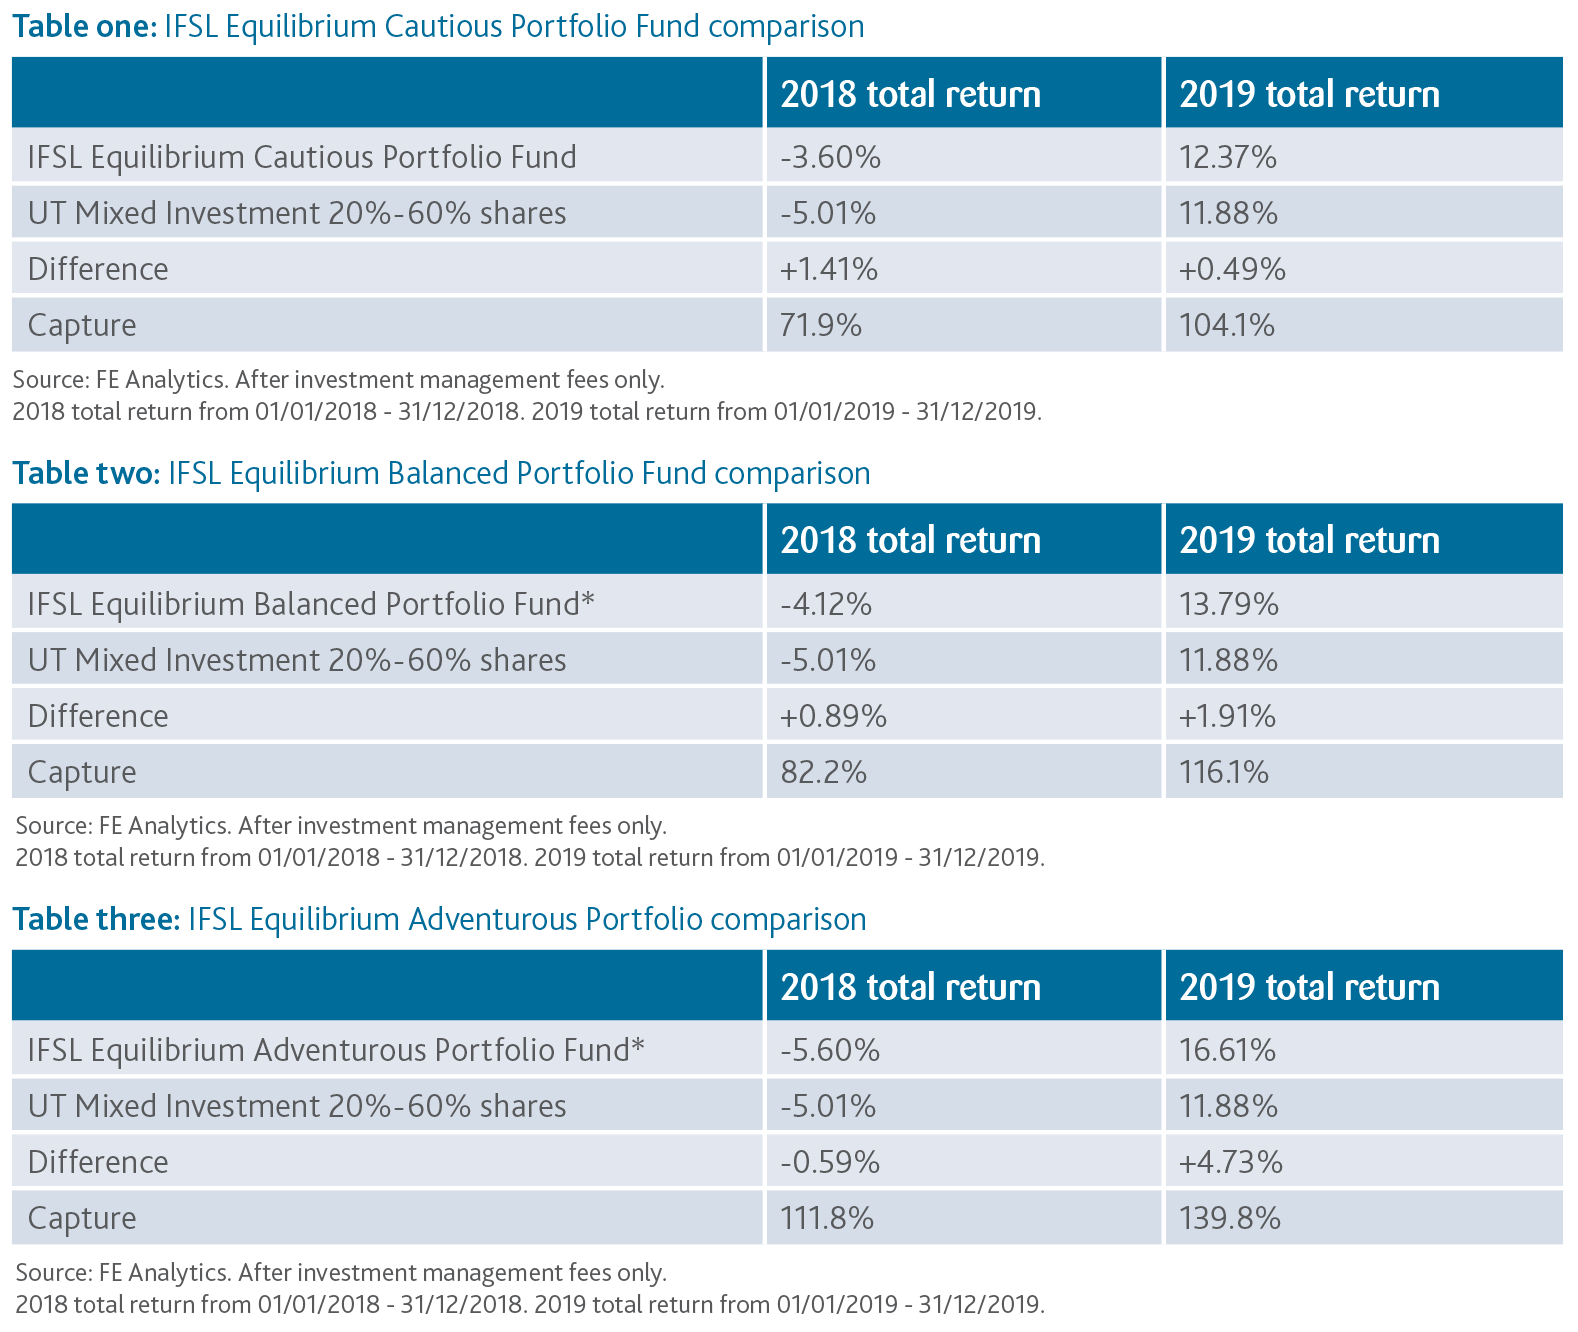
The tables look at how much of the losses each portfolio ’captures’ when markets fall, and how much of the gains we capture when they go up. For each of the funds, the upside capture percentage is higher than the downside capture percentage.
The returns we’ve seen in the recent drops have been in line with these expectations. If we can continue with these sorts of upside and downside capture metrics we will end up in a good place.