Why investors need to move on from 2018

Last year was tough for investors, with many now worried about what the rest of 2019 will be like. However, things aren’t as gloomy as they seem. Graeme Black explains why investors need to stay positive and keep a long term view.
Ten years on from the financial crisis, 2018 was a landmark year but also one to forget for many investors. It started out on a good footing before momentum slowed and ending with a very painful 4th quarter.
There were several drivers behind this. Looking back to 2017 with synchronised growth of global economies, economic data was beating expectations and central banks were fueling the investment fire with accommodative policy – investors were lapping it up as, which was reflected in the high valuations.
Then in 2018, investor sentiment waivered, cracks were beginning to appear in the economy as the pace of growth began decelerating amidst ongoing trade discussions between the largest economies. With earnings less certain and the concerns about the pace of monetary policy tightening by the Fed – investors retreated which resulted in some fairer valuations.
Throughout 2018 there really had been few places to hide from volatility, and in last month’s investment newsletter Analyst, Neal Foundly, highlighted that 93% of asset classes surveyed by Deutsche Bank had ended the year down. In this environment there wasn’t much hope for traditional multi asset class investments to deliver positive returns given nearly all asset classes suffered.
However, things are not as gloomy as they seem. With the help of a bit of data, I’m going to show the importance – and potential benefits – of adopting a long-term view.
Bad year?
So how bad was last year? Table 1 compares the annualised returns our model portfolios from 2018 against a selection of various unit trust sectors and the FTSE 100. Unsurprisingly our portfolios and the average multi asset manager were down over the year. Out of our portfolios, cautious lost the least and adventurous the most, while the money market sector in our observations made the only positive return over the year.
Investing is about dealing with market falls as much as it is looking for opportunities to capture gains. The team and I always have to be prepared for adverse market conditions and ensure we are not exposed to more risk than we need to be. And this table shows that while the FTSE fell over 8%, our portfolios did not suffer as badly. This underlines our investment philosophy, that we are not solely focused on increasing returns for clients, we are also focused on minimising losses.
Table 1: Annual Performance of Equilibrium portfolios
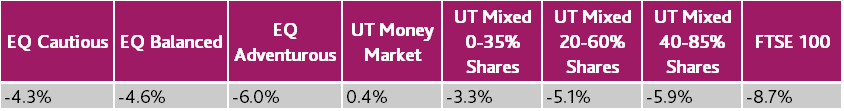
Table 1: FE analytics – EQ performance net of fees (data from 31/12/17 to 13/12/18)
Worst Year?
Although 2018 wasn’t a great year, it was by no means terrible, Table 2 shows the best and worst return you could have received in a 12-month period since 2008 when Equilibrium launched our discretionary portfolios.
The worst period for all, except in the money market sector, was the annual period ending March 2009 – this period bore the brunt of the financial crisis – our cautious portfolio lost over 11% whilst the FTSE lost close to 32%
Interestingly the best year for all, except for the money market sector, was that ending April 2010. As markets bounced back following the financial crisis our cautious portfolio recovered and returned over 28%, similarly the FTSE rallied strongly too by returning over 50%.
The table reminds us of the risk/reward nature of investments (not to mention the volatility), the comparators in the table that lost least in their worst 12-month period were also the comparators that gained the least in their best period. Again, like in Table 1, you can see our portfolios did not suffer as badly as the market did. The most you would have lost in any 12 months in the money market sector is 0.5%, however the largest gain would only have been 2.3%!
Table 2: Best and worst annual periods for Equilibrium portfolios
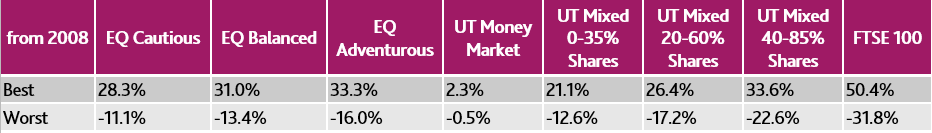
Table 2: FE analytics – EQ performance net of fees (data from 31/12/17 to 31/1/19)
Long term
As investors we try not to focus on the short term. Chart 1 looks at annualised returns for all five, four, three, two and one year periods for our Balanced portfolio since 2008 and reflects the best and worst return periods compared against the average.
What we see here is pretty stark, over one year there is a significant gap between the highest gain and the deepest loss, but this narrows considerably over the three, four and five year periods.
Chart 1: Best, worst and average annualised returns (Equilibrium Balanced portfolio)
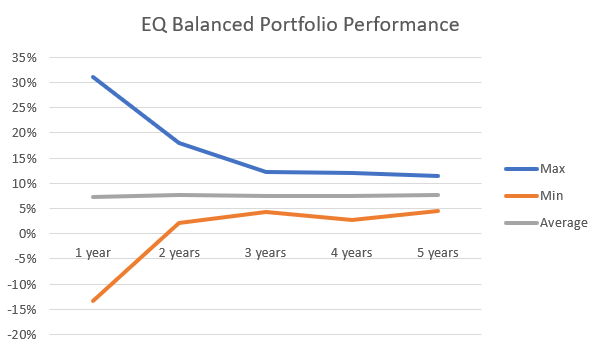
Chart 1: FE analytics – EQ performance net of fees (data from 31.12.17 to 31/1/19)
Market volatility is part and parcel of investment life and it is a fool’s errand to try and predict what will happen in the future. However, by stepping back and looking at the data, we can see some patterns of market behaviour and gain more confidence in long term investment returns.
Table 3 shows the data from Chart 1 together with our cautious and adventurous portfolios and here we can see how uniform the longer investment periods are. The biggest gains and losses are typically found across all the portfolios in the one-year column.
Over the course of two or more years any short-term movement has had the opportunity to correct somewhat – this could be a good period being followed by a not so good one or, like in the case of 2008-2010, an awful year being followed by a fantastic one.
Table 3: Best, worst and average annualised returns for Equilibrium portfolios
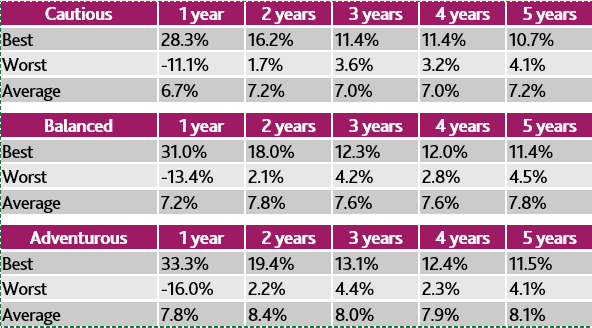
Table 3: FE analytics – EQ performance net of fees (data from 31/12/17 to 31/1/19)
Though 2018 was tough, we were tilted towards a more defensive positioning, so it was not unexpected. And with so many alarmist headlines and scary looking graphs, it can be hard for investors to keep calm and look ahead. It is a natural instinct for human nature to leap to an immediate conclusion when faced with markets like this. This is where having a disciplined and thorough investment strategy becomes especially important.
If you’d like to learn more about how Equilibrium Investment Management manages portfolios, why not get in touch?
Disclaimer: The information provided through the Equilibrium website is based on our opinion and is for general information purposes only. It is not, and should not, be construed as financial or investment advice. The value of your investments can fall as well as rise and are not guaranteed – Past performance is not a guide to future performance. Investors may not get back the amount originally invested.