
Preparing for the unpredictable
Executive Summary
- The current economic environment is highly unpredictable, driven mainly by geopolitics.
- This makes the short-term outlook for investments very volatile and impossible to forecast.
- However, over the long term, portfolio returns have been well ahead of inflation, even as economies have experienced many crises along the way.
- We also see evidence which makes us optimistic about the prospect for long-term returns in the future.
Short-term volatility
There is one chart which neatly sums up just how uncertain the economic and market outlook is right now.
Chart one shows the wholesale price of natural gas here in the UK and how it’s changed over the past two years.
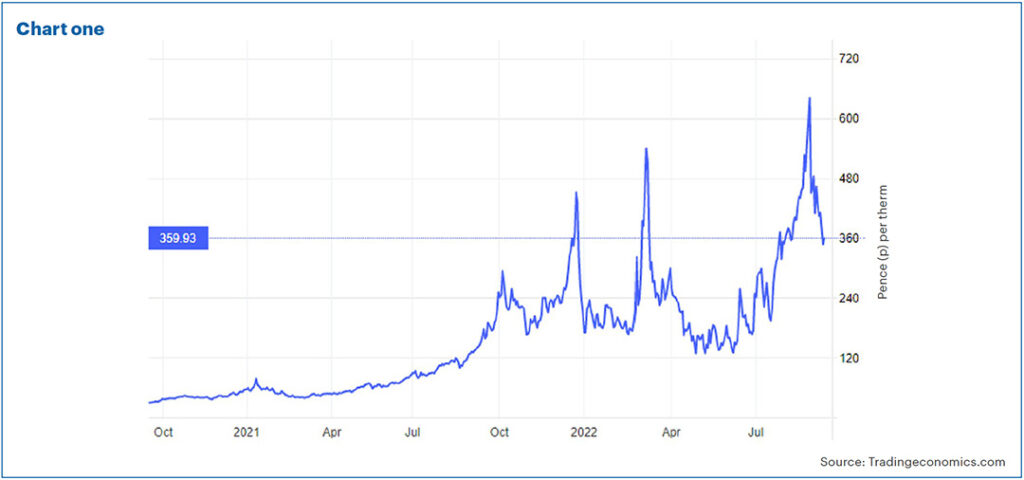
Over two years, the wholesale price of gas has gone up from around 35p per therm, to over 350p per therm – more than a tenfold (1000%) increase.
That’s pretty shocking. But prices rose even further, hitting an even more shocking 640p on 26 August. At that point, the price had gone up more than fivefold (500%) in just the previous three months!
Since then, the price has almost halved.
The point is that this is extremely volatile. This chart neatly illustrates the highly unstable geopolitical situation we find ourselves in.
The price ramped up in July and most of August as gas flows from Russia reduced, and now those via the Nord Stream pipeline have come to a complete halt.
The subsequent fall is because the UK government (and others in Europe) have intervened.
I must confess that 12 months ago I knew very little about natural gas supply and markets. I might have been forced to learn a bit more these days, but I still must admit I don’t know what Russia will do next or how Western governments will respond.
For more information on the gas market, see Neal Foundly’s recent blog, ‘Running out of gas – why the price bubble?‘
Apart from anything else, it is quite astounding how much of this is driven by speculation rather than real supply and demand!
These geopolitical events of course make a huge difference to the outlook for inflation, interest rates, the economy and our investment portfolios.
Given this uncertainty, how are we meant to forecast what will happen to the economy and market over the next few months? It’s simply not possible.
The good news is, we don’t believe we need to.
Looking backwards
Our core portfolios are designed to outpace inflation over the long term.
Ideally, we would like to see a balanced portfolio (for example) beat inflation by an average of 5% per annum over the long term (10 years or more). This is a deliberately tough target (and much tougher recently) but still one we believe is appropriate.
Chart two shows the returns of our balanced portfolio in blue over the last 10 years. The green line is inflation (Consumer Prices Index – CPI), and we can see that despite the recent increase in inflation, the portfolio has far exceeded CPI over this period.
The red line is the average mixed investment fund that takes a similar level of risk – the UT Mixed Investment 20-60% shares sector. Our balanced portfolio has significantly outpaced the average “balanced” fund.
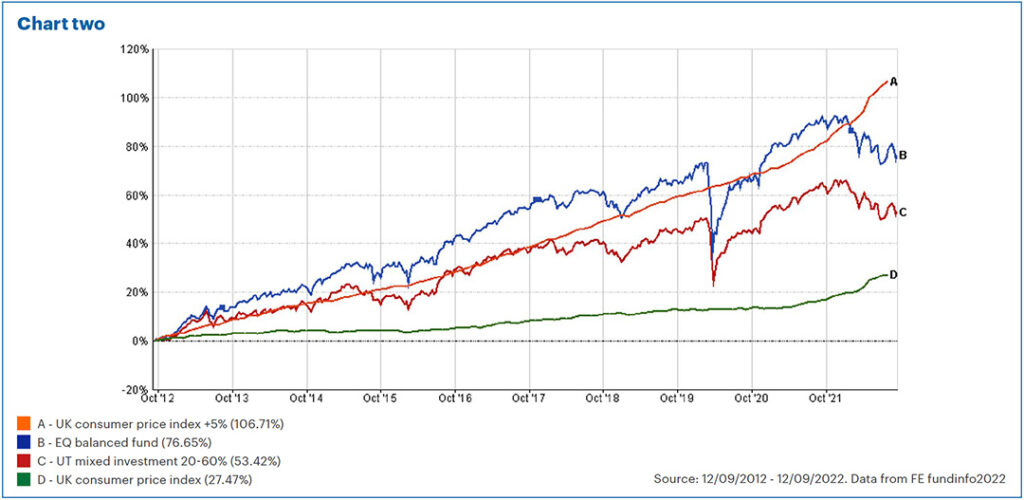
The orange line is the target return of CPI +5% p.a. Here, we unfortunately fall somewhat short, with the “real return” above inflation being just over 3.5% pa above inflation rather than the target 5%.
Whilst we have fallen short of the target over this 10-year period, it is interesting to note that only recently the portfolio dipped behind. As markets have fallen this year and inflation surged, the two lines have gone in different directions. However, the portfolio was ahead of target for approximately 9 out of the last 10 years.
We accept that we will not always beat the target – it is a target, not a guarantee – and this is especially difficult when inflation is so high. However, looking at the above data still reassures us that it is an appropriate aim. Despite CPI hitting 10.1% (it has since dropped back to 9.9%), the portfolio returns are not that far short.
Importantly, when our financial planners look at your own personal projections, we don’t use CPI +5% per annum. As a general rule, our financial plans are based on achieving CPI +3%, which has been achieved over the past decade, despite the recent inflation spike. We deliberately build in a margin of safety into all such projections, so you can plan with confidence.
Looking forwards
Importantly, we are very optimistic that the target returns can be achieved over the next 10 years.
For the past few years, we have carried out an annual study and published what we think the future returns of the various asset classes might be.
We have tried to remove the emotions out of this exercise and simply look at past evidence. For most asset classes, there are valuation metrics that we can use that given us some idea of future returns.
Almost without exception, these valuations are far more attractive than they were 12 months ago.
To illustrate, let’s take one of the most predictable asset classes, which is government bonds.
As of 31 August 2022, the yield on a 10-year gilt was 2.8% p.a. This means, if you buy that bond and hold it to maturity, your return will be equal to 2.8% per year. The bond is guaranteed by the government and the interest is fixed.
During that 10-year period, the price of the bond may go up and down, but provided we hold for the full period we know exactly what return we’ll get (provided the UK government doesn’t default on its debts). The expected return on gilts is therefore 2.8% p.a.
A year ago, the yield was only around 0.7% p.a. and so the expected return has increased by 2.1% p.a. over the past 12 months. (Source: Refinitiv)
A corporate bond works in a similar way to a gilt, but here you are lending money to a company. This comes with more risk, as the company can go bankrupt. However, the yield again gives you a decent idea of the potential return.
Again, if we look at one year ago, a typical “investment grade” (relatively secure company) bond gave you a yield of c.1.75% p.a. Now the same type of bond yields over 5% p.a. (Source: Refinitiv)
As you move up the risk scale, the uncertainty around the forecasts increase. However, even in equities, there are metrics which have historically given a good idea of future returns.
We often talk about price/earnings (PE) ratios, which, historically, have been one of the better indicators.
Sometimes, I think it’s better to look at this in a different way. For example, if your price is currently ten times the earnings (post-tax profits) made by the company, we call that a PE ratio of 10.
Another way of looking at the same thing is to turn the equation around, and instead look at the profits as a percentage of the company’s value (or ‘earnings yield’ as it is known).
A PE ratio of 10 is the same as saying the earnings yield is 10% p.a. In other words, if the company paid all its profits out as a dividend, the yield would be 10%.
Logically, in that situation, if the company just stood still and didn’t grow its profits (and they didn’t fall either), then you would expect a return of in the region of 10% p.a. from that stock.
There are now a few markets where the earnings yield is 10% or more. For example, in UK smaller companies or in Chinese stocks (according to Refinitiv data). Not all markets are quite as cheap as that, but many are below their long-term average valuations and at levels where we have seen positive returns in the past.
We therefore think that by carefully constructing the right mix of regional exposure, a typical equity portfolio ought to be able to achieve around 10% per year for the next decade. This is just based on current valuations, and what has happened in past periods when valuations have been similar.
Crucially, this is not based on us being particularly clever and finding the best active fund manager for each region or switching between asset classes at the right time. It is simply what is the implied return of the market based on history.
History may not be repeated. Things may be completely different in the future (they could of course be better than we expect as well as worse). However, we think there are solid reasons to expect that the portfolios can achieve their target returns over the next 10 years. What happens over the next few months, however, will be determined largely by governments and central banks.
Uncertainty
The biggest uncertainty affecting our forecasts in our view, is around inflation. Clearly, inflation forecasts have proved unreliable of late.
For purposes of this analysis, we have assumed that the inflation implied by the market is correct. At present, market prices imply UK CPI will average somewhere in the region of 2.5% p.a. over the next decade.
That is roughly what we have seen over the past decade, including the effect of the most recent 10.1% p.a.
Given the recent government intervention, we think we are somewhat near the peak of inflation and the rate that prices increase should reduce from here. Typically, after bursts of high inflation in the past, we have been more likely to see incredibly low inflation (even deflation), than continued high inflation.
We therefore think there is a decent chance that inflation could actually be lower than the market expects. As I mentioned earlier, we aim to build a margin of safety into our plans.
We expect that the forecasts will not be entirely accurate. However, going through this exercise gives us a framework to help position the portfolios, to give us the best chance of achieving target returns, within the risk parameters of each portfolio.
Past performance is for illustrative purposes only and cannot be guaranteed to apply in the future.
This blog is intended as an information piece and does not constitute a solicitation of investment advice.